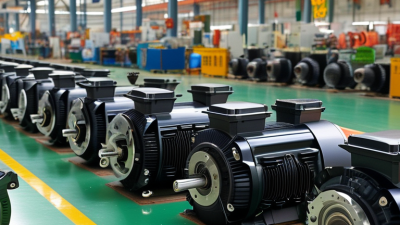
Top 10 Electric Motor for Vehicle Suppliers Worldwide
The global vehicle industry is entering a decisive electric-powertrain era. According to the International Energy Agency’s Global EV Outlook 2024, worldwide electric-car sales exceeded 14 million units in 2023. Nearly one in five new cars sold was electric. This expansion is increasing demand for efficient, compact, and durable Electric Motor For Vehicle systems.
Fatih Birol, Executive Director of the International Energy Agency, has said, “Electric cars are becoming a global phenomenon.” His observation reflects more than rising showroom sales. It also highlights a demanding supply chain. Manufacturers now compete across permanent-magnet motors, induction motors, hairpin windings, silicon-carbide inverters, and integrated drive units. Each component affects acceleration, thermal stability, driving range, and production cost.
The Top 10 Electric Motor for Vehicle Suppliers Worldwide examines companies shaping this competitive field. It considers production scale, research investment, motor efficiency, regional reach, and relationships with major vehicle brands. Data from the IEA, BloombergNEF, and Deloitte automotive studies provides useful market context. Company filings and technical disclosures add another layer of verification.
The picture is not perfectly clean. Supplier rankings can change quickly. Some firms report motor shipments, while others report complete e-axle systems. Comparisons may therefore contain unavoidable gaps. Still, real-world details matter: a quieter motor at highway speed, stable performance during repeated acceleration, and reliable output on a steep winter road. These practical measures help distinguish engineering leadership from impressive marketing.
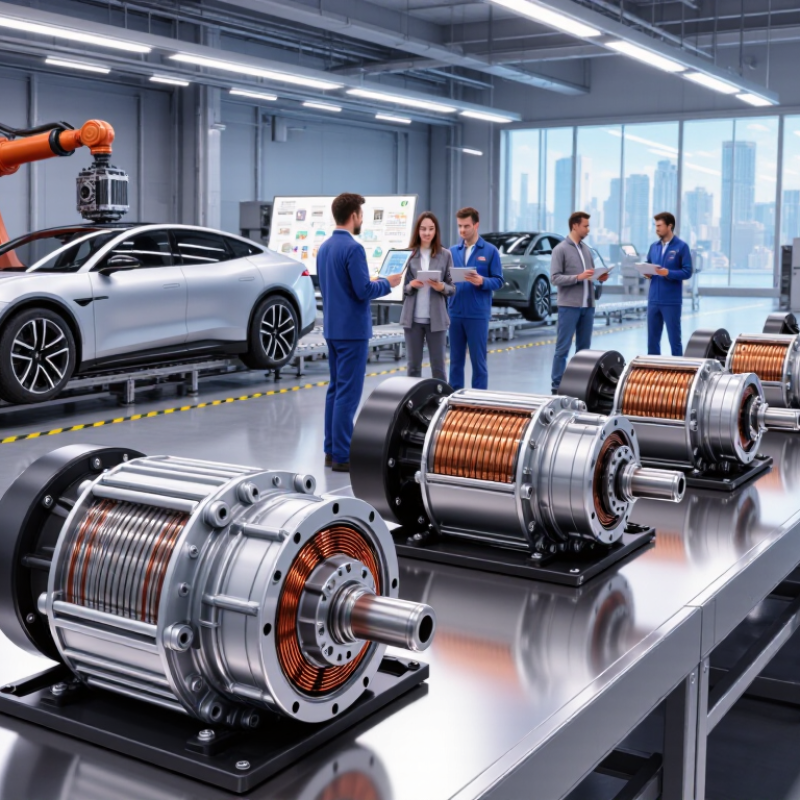
Global EV Motor Market: 14 Million Electric Cars Sold Worldwide in 2023
Global EV Motor Market: 14 Million Electric Cars Sold Worldwide in 2023
Around 14 million electric cars were sold worldwide in 2023, according to widely cited industry estimates. That volume changed the motor supply chain from a specialist market into a mass-production race. Vehicle manufacturers now assess suppliers on efficiency, durability, noise control, and delivery capacity.
The top 10 electric motor suppliers for vehicles are not judged by output alone. A serious review examines permanent-magnet motors, induction designs, axial-flux systems, and integrated drive units.
Engineers also check thermal performance during steep climbs, highway driving, and repeated fast charging. A motor that performs well on a test bench may behave differently in winter traffic.
Reliability data matters. So does repairability.
Suppliers must maintain tight rotor balance, consistent winding quality, and stable production tolerances. Many buyers also study inverter compatibility, software control, and material sourcing. These details affect driving range and long-term operating costs.
Yet supplier rankings remain imperfect. Public sales figures often combine different motor types, regions, and vehicle categories. Some companies disclose little technical information, making direct comparisons difficult.
A careful buyer should therefore treat any “top 10” list as a useful starting point, not a final verdict. Performance depends on the vehicle platform, battery design, climate, and service network.
Motor Technologies: Efficiency Ranges of 90–97% Across Leading Designs
Electric vehicle motor suppliers now compete through efficiency, durability, and thermal control. Across leading designs, measured efficiency commonly ranges from 90% to 97%. Permanent-magnet synchronous motors often approach the upper end during steady, moderate-load driving. Induction and switched-reluctance motors can reduce material dependence, but operating losses may increase under demanding conditions. That trade-off matters. A motor’s peak figure does not represent every road situation.
Reliable evaluation requires more than a catalog percentage. Engineers should examine dynamometer results across speed, torque, voltage, and temperature. In real testing, copper losses grow during acceleration, while cooling systems consume additional energy. Inverters also influence the final system efficiency. A 97% motor may perform below 90% during repeated climbs or cold starts. This is where specifications can feel incomplete, and buyers should question unusually perfect claims. Independent test records, warranty terms, and production consistency offer stronger evidence than promotional language.
Tips:
Compare efficiency maps, not single values. Ask for results at city speed, highway speed, and maximum load. Check thermal limits and cooling requirements. Request testing methods and measurement tolerances. A small efficiency gap can become significant across thousands of operating hours. Efficiency alone is not enough. Reliability may matter more.
Top 10 Global Vehicle Motor Suppliers by Scale, Region, and OEM Reach
Top 10 Electric Motor for Vehicle Suppliers Worldwide
The global vehicle motor market is shaped by scale, regional production, and OEM reach. The leading ten suppliers typically operate multiple plants across Asia, Europe, and North America. Their portfolios cover traction motors, integrated drive units, and auxiliary motors for passenger and commercial vehicles.
Scale matters, but it does not tell the whole story. Large suppliers can support high-volume programs, stabilize component purchasing, and provide local engineering teams. Regional coverage also reduces shipping delays and simplifies service coordination. Some suppliers have stronger positions in electric passenger cars, while others focus on buses, trucks, or hybrid platforms. That difference affects their real market influence.
OEM reach is another practical measure. A supplier serving several vehicle manufacturers may have wider validation experience and stronger production discipline. However, shared platforms can hide differences in motor efficiency, thermal control, and software integration. A compact motor with excellent cooling may outperform a larger unit in daily traffic. Testing data should include heat cycles, voltage variation, road loads, and long-term durability.
No ranking is perfect. Public production figures may combine motors with complete drive systems, creating uneven comparisons. Regional sales can also change quickly as factories open or contracts expire. Buyers should examine plant capacity, local certification support, warranty records, and response times before treating market scale as proof of technical leadership. Numbers help, but field evidence matters more.
Top 10 Electric Motor for Vehicle Suppliers Worldwide
Regional electric-car sales provide a measurable proxy for the addressable OEM market and potential demand for traction-motor suppliers. China represented the largest market in 2023, followed by Europe, the United States, and other regions.
Source: International Energy Agency, Global EV Outlook 2024. Values are rounded estimates for 2023 new electric-car sales and exclude supplier or brand-level data.
Supplier Comparison: Power Density, Voltage Platforms, and Production Capacity
A top-ten electric motor supplier comparison should begin with measurable engineering data, not reputation. The IEA’s Global EV Outlook 2025 reports more than 17 million electric car sales in 2024. That scale is pushing suppliers toward higher output and tighter quality control.
Power density remains a key separator. A compact motor can reduce vehicle weight, cooling demand, and installation space. However, published figures are not always comparable. Some suppliers report peak power density, while others use continuous ratings. That difference can distort rankings. Voltage platforms provide another clear test. A 400-volt system suits cost-sensitive vehicles, while an 800-volt platform can reduce current during fast charging. It also supports thinner high-voltage conductors, although insulation and switching costs increase. The U.S. Department of Energy identifies efficiency, thermal management, and inverter integration as core electric-drive development priorities.
Production capacity needs equal attention. The IEA notes that China produced more than 70% of global electric cars in 2023, revealing the importance of regional manufacturing depth. For each supplier, buyers should verify annual motor capacity, plant utilization, automation levels, and local service coverage. Reported capacity may be theoretical. Actual delivery can differ. This is where supplier assessments become imperfect, especially when contract manufacturing and shared facilities are hidden. A practical score should combine measured power density, validated voltage compatibility, warranty data, and audited production records. Not just catalogue claims.